AMforum Journal 2
Reactance type tap changers use preventive autotransformer (PA), a reactor, as a mode of limiting circulating short circuit current when the transformer operates in the bridging position. An excellent explanation of the reactance tap changer operation is given by Steven Larson [1]. Understanding the principles and peculiarities of operation is of essence for proper evaluation of dynamic resistance measurement (DRM) graphs. This method was well researched in order to perform a condition assessment of resistance type on load tap changers (OLTC) and published as a doctoral thesis [2]. Let's concentrate in this presentation on reactance types, predominant in the USA networks, and not easily understood in the realm of DRM testing.
We are going to analyze operation of three types of tap changers:
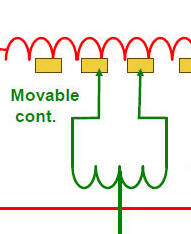
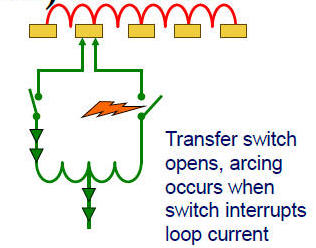
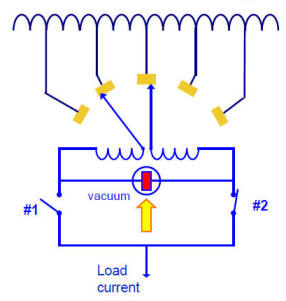
There are two operating principles of reactance tap changers: with one moving arm operating two contacts in parallel, and two independent moving arms, each one with its contact. Both models may use transfer switches, some do not - furthermore those with vacuum contactors use bypass switching.
Arcing tap switch Transfer switch that arcs Bypass switch does not arc - interruption is in vacuum
VARIATIONS OF DRM GRAPHS
We have noticed two types of DRM traces, type 1 with larger distinct ripple and type 2 with small changes - rather a current adjustment than a ripple.
![]()
DRM graph Type 1 : four transitions
![]()
DRM graph Type 2 - two transitions, motor current is the green-color trace
Two different tap operations - from bridging to non-bridging, and non-bridging to bridging provide two distinct DRM transition graphs. For type 1 graph we observe just a difference in the ripple magnitude - while for the type 2 the transitions look completely different.
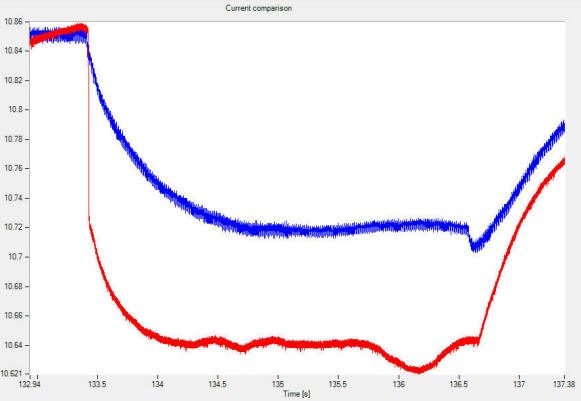
On top of everything explained above, we have two distinct transition graphs that may look like a mirror images for tap operations in one direction (16R to 16L) vs. the other direction (16L to 16R), as shown in the figure below.
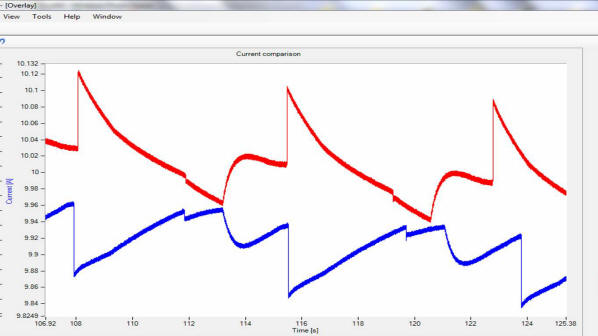
Transition traces up (blue) and down (red) are like mirror images in certain cases
FEATURE POINTS
Five feature points may be observed on the graphs:
a. motion of contacts (start of operation)
b. separation of contacts
c. contacts sliding
d. contacts making
e. final stop of the motion
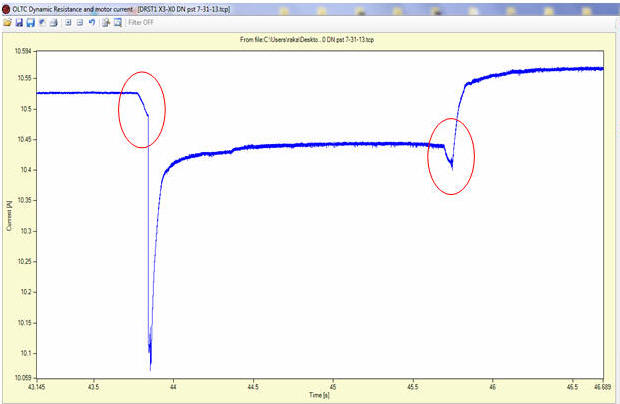
The start of motion can be observed on many tap changers as a short current drop at different angle than the bigger subsequent drop due to the contact switching. In the figure below two red circles mark the features "a" and "e" associated with the start and stop of the contact motion. Moment of contact breaking and making is obvious, indicated by sudden current change.
Tap changer construction with a single two-contact moving arm, during the operation slides the current-carrying contact while the other one is disconnected. This allows us to see the feature "c" waveform during the contact sliding (the moving one slides over the stationary). For the mechanism with two moving arms this feature cannot be detected because the moving contact is the one disconnected by the transfer switch.
Two different waveforms showing two differently
worn contact surface conditions
Certain manufacturers provide for their vacuum tap changers a "sequence circle diagram" [3] that indicates exact timing of switches operation. For those tap changer types it is very important that the timing is correct. Recording the motor current allows us to measure the switch timing and compare with the manufacturer's specification given in degrees. An example provided in the figure below gives us the power to measure exact timing of four events, and verify switch operation timed from the motor start point:
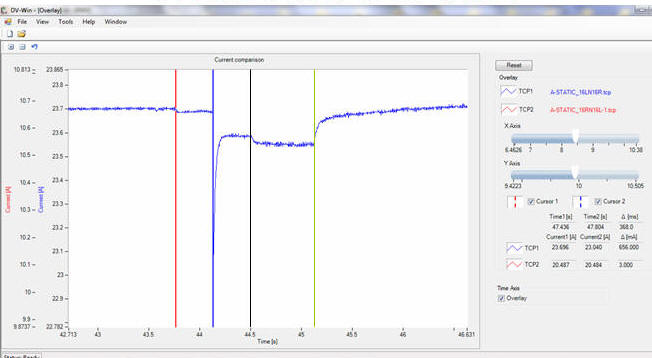
Timing of various
switches' operation.
Preventive autotransformer is an air-gap-core reactor that influences a lot the waveform of the DRM graphs simply by making inductance i.e. resistance to the dc current flow higher than a normal transformer would. The ripple values of the resistance tap changers are in the order of 10-50%, while ripple of a typical reactance tap changer is about 1% or even less. Although the ripple is small, tap changer defects create significant difference in the DRM graphs when compared with the normally operating units or a good phase on the same unit, as shown with couple of cases at the Cired presentation [4].
Conclusion:
It is very difficult analyzing reactance DRM graphs without knowing the exact type of OLTC, and even then - based on the transformer parameters and direction of the tap changer operation we may see great difference in DRM graphs for the same tap changer model. Once this issue is overcome, the DRM method becomes a very powerful tool for condition assessment of tap changers on power transformers [5].
References:
[1] S. Larson, "OLTC Fundamentals", MRcademy, Everet WA, 2011
[2] Jur Erbrink, Doctoral thesis: "OLTC Diagnosis on High Voltage Power Transformers using Dynamic Resistance Measurements", Technische Universiteit Delft, 28. March 2011
[3] MR - RMV II tap changer operational manual
[4] G. Andersson, R. Levi, E. Osmanbasic, “Dynamic tap changer testing, reactors and reactance”, CIRED, 22nd International Conference on Electricity Distribution Stockholm, June 2013, Paper 0338.
[5] Eric Back, PG&E, “Dynamic Resistance Testing of OLTC, TDA – Tap-changer Dual Assessment”, Finepoint conference, USA 2011
Contributor:
Dr.ing. Raka Levi
Based on notes from a Training Track lecture given in Phoenix AZ, February 2014