Introduction
Voltage regulators have been frequently applied as "external tap changers". The power transformer is not equipped with the on load tap changer, thus minimizing the cost and consequence of a failure, and for that reason a separate regulator regulates the voltage. Testing DRM (dynamic resistance measurement) on voltage regulators is identical to any autotransformer, the attention should be paid to the position of the tap changer, i.e. between what terminals it is located. Furthermore, the overall DRM graph looks somewhat different from a regular transformer due to the inherently low impedance at the neutral position.
Voltage regulators
The regulator neutral point is usually marked as S0L0 (or SL for a single phase unit), where the source terminals are S1, S2, S3 and the load terminals are L1, L2, L3. A tap changer is located in-between source and load sides. Thus, the DRM test path should be established in such a manner that the least inductance is involved. From the schematic in the figure below it is obvious that the test path from S0L0 to S terminals will not provide any DRM graph, while between S0L0 and L terminals includes the inductance of the common winding. The best DRM response could be obtained when testing S to L - a path that includes only the regulating winding with the tap changer.
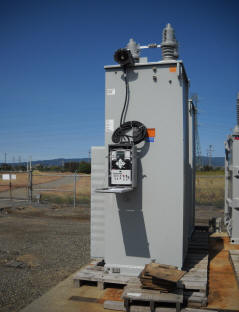
The simplest regulators we tested are small single phase units as the one shown in the picture below by Cooper Power Systems rated 220kVA at 22kV. Range of regulation is usually +10% in 32 steps of 5/8%. Three phase units are much larger and can be of significant MVA rating.
Different manufacturers provide tap changers of resistance, or reactance types. Some are equipped with vacuum interrupter.
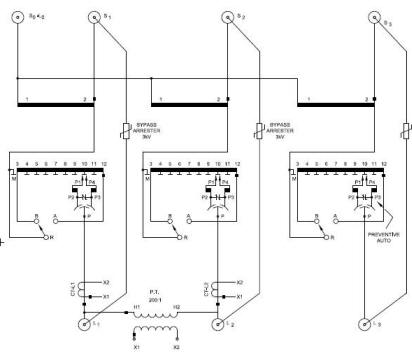
Three phase Regulator schematic diagram showing all terminals
DRM testing
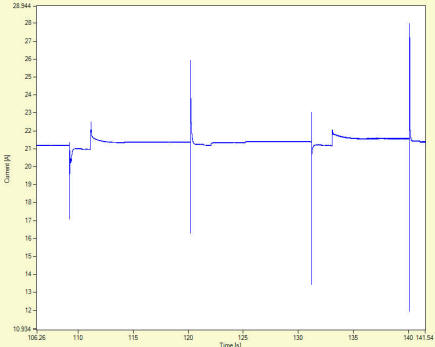
The DRM test provides an overall graph of a peculiar shape as shown in the picture below left. As the tap changer is of a reactance type design, the ripples alternate in length as the transitions go from bridging to non bridging and vice versa. The picture on the right shows a similar graph outline. The difference is
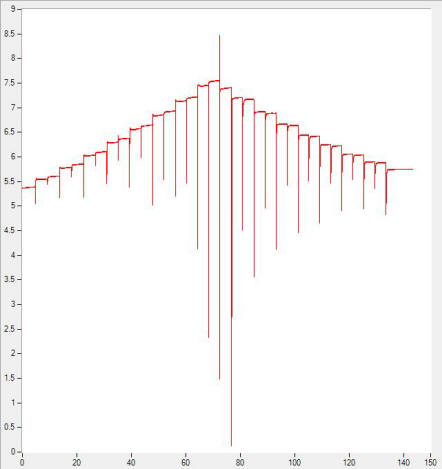
Typical good regulator overall DRM graph
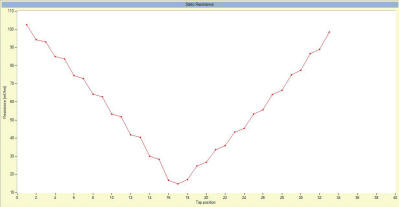
Winding resistance in all tap positions
Our experience
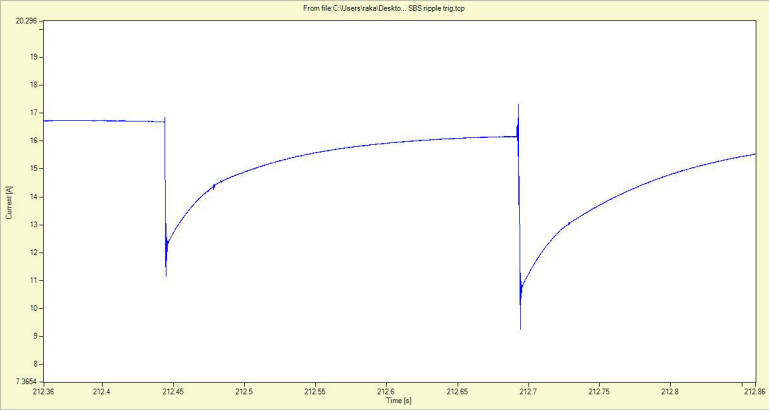
When testing a voltage regulators we have observed several characteristic features of the DRM graphs. The ripple shape remains the same but the ripple value increases as we approach the neutral and afterwards decreases when moving away from the neutral position. It is obvious that the inductance and resistance as we get closer to neutral position, where the turns ratio of source to load is 1 (one), diminish as the number of turns between S and L drops to zero.
As we
switch closer to neutral , transition ripples become larger
Switching oscillations around neutral position, due to very low inductance may create perceived "discontinuity" situation where a defective tap changer opens the circuit. However, this is not usually the case, figure below shows the detail of transition ripple where the current goes to zero.
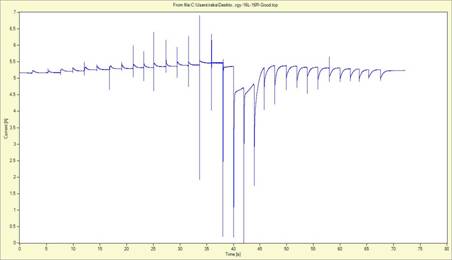
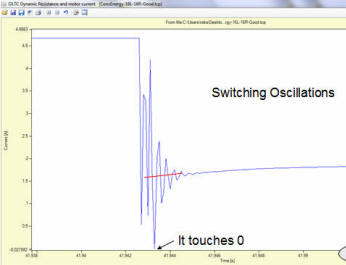
Fig. Suspicious transitions around neutral approach 100% - however this is due
to switching oscillations, not opening the circuit
As one can observe from the graph above on the left, recovery time is much longer around neutral than the switching time itself. For that reason current does not reach the steady value before the next transition is initiated, making a characteristic "dip" in the waveform (first three transitions after the neutral).
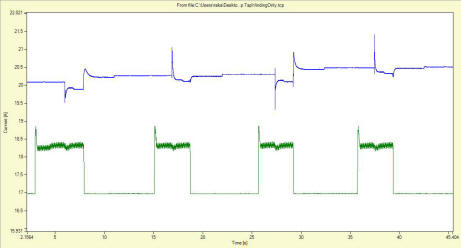
Another interesting feature of smaller regulators is a very fast motor operation. We have recorded switching times in the order of 4 per second, that tap design would go from 16L to 16R in about 10 seconds
Two transitions within 250 mSec
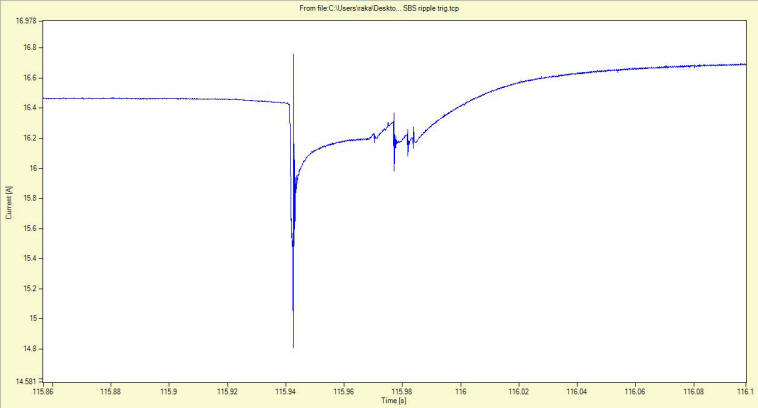
One quick transition where Transition time (reactance type - breaking to making) is about 50mSec